Metatrader 5 importing Tickdata
About
In July 2017 Metaquotes introduced the capability to create custom symbols including the possibility to import your own price data.
The lacking possibility to import custom price data has always been one of the major reasons for me to pass on Metatrader 5.
Now, more than 8 (!) years after its initial launch Metaquotes finally implemented this much asked for feature. Time to take a look how it's actually working.
Creating M1 Bars
Expected Format
The first thing to note is that as of now you need both Tick and Bar data to perform a backtest on custom price data as MT5 seemingly can’t downsample the provided Tickdata by itself. Luckily, creating these M1 Bars just takes a couple of lines in python code.
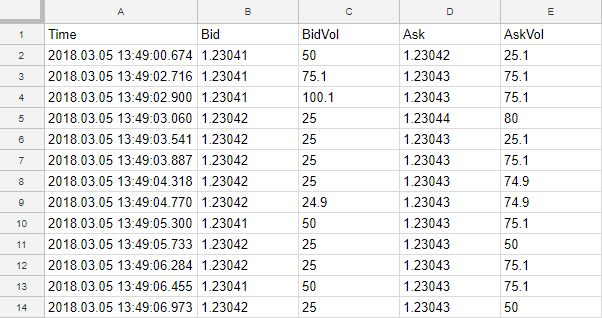
We have to take a look at the format of our saved Tickdata first and adjust it to the expected MT5 format. My sample data looks like this.

Metatrader expects the imported Bar data to have the following structure:

Whereas Tickdata needs to be formed like this:

Preparing the Data
Creating OHLC candle data from Bid, Ask prices is easy enough with only a few lines of Python code. The first step is to read our file containing the Tickdata. Keep in mind that if you want to convert a huge amount of price data (multiple GB) you might run out of memory. In this case, you will need to split this data into chunks first before going forward.
import pandas as pd
FILE = 'EURUSD.txt' #our tickdata
usecols = [0, 1, 3] #we only use time, bid and ask
df = pd.read_csv(FILE,
                usecols = usecols,
                names=['DateTime', 'Bid', 'Ask'],
                parse_dates=['DateTime'], index_col=0,
                float_precision = 'round_trip')
After we have loaded our Tickdata we are going to use Pandas resampling feature and downsample our Tickdata to M1 candles with a single line of code. To avoid having invalid candles once there is no data during a 1-minute timespan (e.g Rollover) empty rows are dropped.
bid = df['Bid'].resample('1Min').ohlc().dropna()
As Metatrader 5 expects the spread in points for its M1 Bar data, we will do another resample of the ask prices and calculate the corresponding opening spread of the M1 bars. Additionally, we add “fake” columns for Volume and Tick-Volume as MT5 also expects those values. In order to draw OHLC candles, Tick-Volume must be greater or equal to 4.
ask = df['Ask'].resample('1Min').first().dropna() #needed for spread calculation
downsampled = pd.concat([bid, ask], axis = 1) #merge bid and ask
downsampled['Tick_Volume'] = 4 #need some tickvolume to draw candles
downsampled['Volume'] = 0 #fake volume
downsampled['Spread'] = (downsampled['Ask'] - downsampled['open']) * 100000 #spread for m1 data in points
downsampled['Spread'] = downsampled['Spread'].map('{:,.0f}'.format) #format spread
downsampled.drop(['Ask'], axis = 1, inplace = True) #not needed anymore
Finally, we just write our downsampled M1 candle data as well as the Bid, Ask Tickdata to *.txt files in order to import them into Metatrader.
downsampled.to_csv("M1_"+FILE, mode='a') #write M1 data
df.to_csv("Tick_"+FILE, mode='a') #write Tickdata
If your TimeDate field has a different format than expected by Metatrader, you need to adjust the date format first before writing to disk. Otherwise, your data won’t correctly import later.
Importing the Data into Metatrader
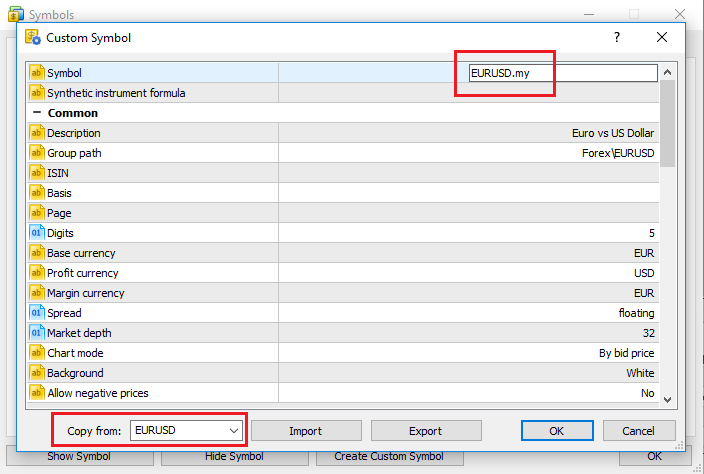
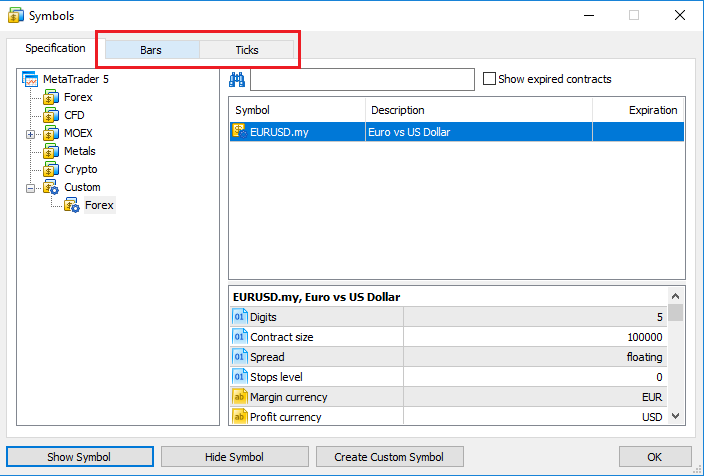
Now comes the final part. Open your MT5 Terminal and the Symbols Window (CTRL + U) to create our own custom symbol. I’d recommend just copying the needed values from an existing Symbol (in my example EURUSD) and just changing the symbol’s name.


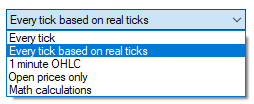
 You can also select your preferred backtesting method. E.g making use of our freshly imported Tickdata using “Every tick based on real ticks”.
For your convenience, you can download the complete python script from our website. If you have any remarks, questions or suggestions please leave a comment!
python_mt5_prepare.py (972.0 B)
https://www.mql5.com/en/code/20225
Many traders have been hoodwinked into paying for special tick data from various sources. They’re wasting their money, in more ways than one.
Any market data that didn’t come from YOUR broker will very likely NOT MATCH your broker’s data. So if you’re trading or testing on data from another source then you are using inaccurate and wrong data.
Read your brokers contract. They will send you whatever they want in terms of data. And their own sources of data are different than other brokers.
Each broker is different.
Fancy tick data from somewhere else is nonsense.
Start setting your EAs to trade ‘once per bar’ or ‘open only’ data. You’ll be glad you did. It will save you a ton of time in backtesting. And the difference between that and same-source tick data will usually be pennies.
Thanks for your comment. You raise some important points. I disagree in parts though. Personally, I am collecting my own Tickdata from LMAX for quite a while and have been using this data to validate my strategies with good success. If you are using smaller Stop-Loss and Take-Profit values in your strategy the results with Metatrader’s emulated Tickdata are pretty inaccurate.
I agree that usually, you should be designing your strategies with open bar data. However, there are a couple of strategies that require accurate Tickdata. And yes, this data can vary strongly between Brokers and if you use the Tickdata from a different Broker you will need to check if your strategy actually works with your Broker as well.
Just because the correct implementation and usage are difficult, it doesn’t make the usage of Tickdata useless, though.
Thank you for the good effort.
I tried to download the python file, but site gives download error “Failed – Forbidden”.
Sorry, I moved the site to a different hoster and forgot to relink the downloads. It should be working again.
How/where you get the bid/ask volume (in your example data table)
That’s just exemplary orderbook bba data. Your own data might be different.