
Equity Curve Straigthness Optimization with Metatrader
About
An underrated feature of Metatrader's Backtester is its ability to define a custom fitness function for the genetic optimization process. Meaning that you no longer are limited to rather simple metrics like final balance or profit factor but can evaluate the quality of each test run with your own individual calculations.
To give a quick overview of what is possible, we will be creating a custom fitness function that is optimizing for the 'straightness' of the equity curve using Lars Kestner's K-Ratio (1996).
K-Ratio
The K-Ratio is a statistical metric with an emphasis on consistency of returns, introduced by Lars Kestner in 19961. It has since then also been adapted by Zephyr Associates under the name “Zephyr K-Ratio”2. Having multiple different Equity curves, yielding the same amount of profit, the K-Ratio will prefer the curve with the most consistent gains (maximum smoothness).
Naturally, most investors also prefer a smooth equity curve over higher profits with deeper drawdowns. So the K-Ratio seems a promising metric to use for our optimization process. The k-ratio is defined as:

Simply speaking, we are drawing the best-fit line through our equity curve and divide the slope of this regression line through its standard error. Doing so, the numerator is becoming the profit component of the fraction and the denominator is representing the risk part.
Additionally, this method favours curves with higher profits (increasing the slope) and a bigger number of trades (decreasing standard error). Generally speaking, the highest K-Ratio represents the smoothest equity curve (considering profit and number of trades).
When implementing this measure in Metatrader’s optimization process we have to take into account that we are only considering closed trades and therefore discard intra-trade drawdowns for simplicity reasons. In order to punish equity curves with big floating drawdowns, we are imposing a drawdown penalty on the k-score.
In order to reject insignificant test runs, we will also be applying an automated minimum sample size calculation, taking into account timeframe and duration of the backtest.
Sample Size Calculation
Let’s start with a simple sample size calculator. By doing a backtest/optimization for our trading algorithm we are trying to verify the assumptions we made, while creating this algorithm, against historical data. Following this logic, we are viewing the bars in this backtest as our population size and the resulting trades as samples. This assumption allows us to apply the sample size determination using z-scores known from statistics3. As a consequence, we simply need to define the confidence level and a margin of error to automatically retrieve the minimum number of trades in order to consider a test run for further analysis. We are using Cochran’s sample size formula for finite populations4.

z = z-score, e = margin of error, N = Population. To preserve maximum variability we are going to assume p = 0.5. Therefore we can simplify p(1-p) = 0.25.
enum econfidence
{
conf90 = 1645, //90%
conf95 = 1960, //95%
conf99 = 2576  //99%

};
enum eerror
{
err1 = 1,   //1%
err5 = 5,   //5%
err10 = 10  //10%
};

sinput string samplesize_info = "";       //------------ Automatic Min Samples ------------
sinput eerror error = err10;              //Error
sinput econfidence confidence = conf90;   //Confidence

//Cochran's Sample Size Formula
int samplesize(int population)
{
double zscore = (double)confidence / 1000;
double ss_numerator = (pow(zscore,2) * .25) / pow((double)error/100,2);
double ss_denominaotr = ( 1 + (pow(zscore,2) * .25) / (pow((double)error/100,2) * population));
return (int)ceil(ss_numerator / ss_denominaotr); //always round up
}
Metatrader K-Ratio Implementation
Having defined our minimum sample size, we are now going forward creating the k-ratio function. If we define the OnTester() function in MetaTrader, the optimizer is using the result of this function as the input value for its genetic optimization process.
Inside the OnTester() function we are looping through all orders of the backtest in order to rebuild the equity curve into an array of doubles (k_profit) for later calculations. While doing so, we also convert the absolute returns to log returns in order to work with normalized values which are required for the following calculations.
As stated earlier we are calculating the k-ratio by dividing the slope of the regression line by its standard error. So let’s first calculate the slope of this best fit line through our equity curve.

In MQL we are summing all x-values (index points) and y-values (accumulated log profit) while looping through the orders in order to get the arithmetic mean afterwards.
double OnTester()
{
ulong ticket;
long start_time = 0;
double balance = 0;
double log_balance = 0;
double k_profit[];

double x_sum = 0;
double y_sum = 0;

if(HistorySelect(INT_MIN, INT_MAX))
{
for(int i = 0; i < HistoryDealsTotal(); i ++) { if((ticket = HistoryDealGetTicket(i)) > 0)
{
long deal_time = HistoryDealGetInteger(ticket, DEAL_TIME);
if(HistoryDealGetInteger(ticket, DEAL_TYPE) == DEAL_TYPE_BALANCE)
{
start_time = deal_time;
ArrayResize(k_profit, 1);
balance += HistoryDealGetDouble(ticket ,DEAL_PROFIT);
k_profit[0] = 0;
}

if(HistoryDealGetInteger(ticket, DEAL_ENTRY) <= DEAL_ENTRY_IN)
continue; // only consider exits

int size = ArraySize(k_profit);
ArrayResize(k_profit, size + 1);

log_balance += log((balance  + HistoryDealGetDouble(ticket ,DEAL_PROFIT)) / balance);
balance += HistoryDealGetDouble(ticket ,DEAL_PROFIT);
k_profit[size] = log_balance;

x_sum += size;
y_sum += log_balance;
}
}
}

int bars = Bars(_Symbol,_Period,start_time, TimeCurrent());
int minsample = samplesize(bars);

if(TesterStatistics(STAT_TRADES) < minsample)
return 0.0;

double x_mean = x_sum / ArraySize(k_profit);
double y_mean = y_sum / ArraySize(k_profit);

double slope_numerator = 0;
double slope_denominator = 0;
double x_sqr = 0;
double y_sqr = 0;
for(int i = 0; i < ArraySize(k_profit); i ++)
{
slope_numerator += (i - x_mean) * (k_profit[i] - y_mean);
slope_denominator += pow(i - x_mean, 2);

y_sqr += pow(k_profit[i] - y_mean, 2);
x_sqr += pow(i - x_mean, 2);
}
double slope = slope_numerator / slope_denominator;
Afterwards, we will continue by calculating the denominator of the k-ratio. The mathematical notation is as follows:
![\textit{\textbf{\large Standard Error}} = \sqrt{\frac{\sum\limits_{i=1}^n (y_i - \overline{y})^2 - \frac{\left [\sum\limits_{i=1}^n (x_i - \overline{x})(y_i - \overline{y}) \right ]^2}{\sum\limits_{i=1}^n (x_i - \overline{x})^2}}{(n-2) \cdot \sum\limits_{i=1}^n (x_i - \overline{x})^2}}](http://klondikefx.com/wp-content/ql-cache/quicklatex.com-5a23ad37bead91dd61c94f043eeecbf3_l3.png "Rendered by QuickLaTeX.com")
The necessary pre-calculations have already been done in the MQL code above. So we can just take these values to calculate the standard error as well as the k-ratio.
double std_err = MathSqrt( (y_sqr - (pow(slope_numerator, 2) / x_sqr)) / ((ArraySize(k_profit) - 2) * x_sqr) );
double kratio = slope / std_err;
Afterwards, we are applying a very simple penalty function for high drawdowns. Feel free to implement something more advanced.
sinput string drawdown_info = "";         //------------ Drawdown Penalty k-ratio ------------
sinput double dd_weight = .5;             //DD Penalty weight
double penalty(double dd)
{
return MathMax(0, 1 - (dd_weight * pow(dd, 2) / 100));
}
Finally, let’s return the adjusted k-ratio from the OnTester() function and let Metatrader do the optimization.
double dd_penalty = penalty(TesterStatistics(STAT_EQUITY_DDREL_PERCENT));
return kratio * dd_penalty;
Testrun
Now let’s put our code into action by including our k-ratio.mqh into the MACD Sample EA that comes with MT5. Afterwards, we start an optimization run over a 1-year period. In order to tell Metatrader to use our custom fitness function, we just have to choose “custom max” from the drop-down in the strategy tester.
Below are two equity curves with similar profits but with very different k-ratios.
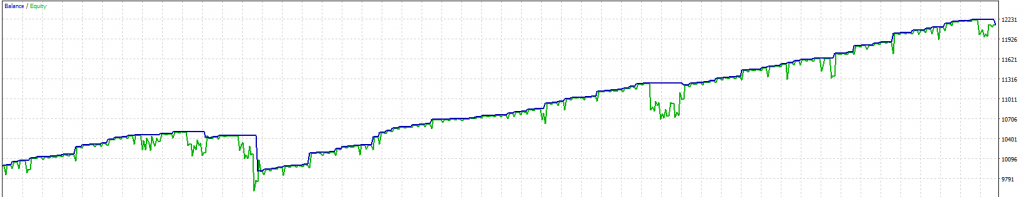
This equity curve has a k-ratio of 27.4 and a net profit of 2145.
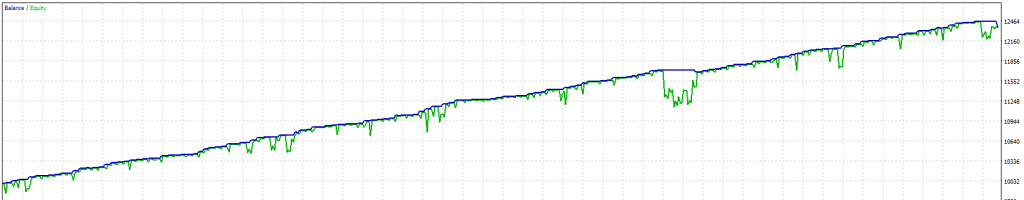
This equity curve has a k-ratio of 274.5 and a net profit of 2378.
Final Thoughts
We have seen that by using Metatrader’s custom fitness function, we can create very flexible optimization runs. This article doesn’t intend to illustrate k-ratio as the single best metric for evaluating trading strategies, as it has certain drawbacks as well.
For one, you need a sufficient number of trades to get meaningful results as the k-ratio is pretty loss averse. Secondly, the k-ratio doesn’t tell you everything about the chronological consistency of the trades. We would prefer to have the trades distributed pretty evenly over our backtest. However, we can’t see from the k-ratio if all trades happened within one month or steadily over the whole backtest.
There are ways around this issue by calculating equity checkpoints at fixed time intervals in order to create a “time-conscious” equity curve. If we use small enough timespans, this would also allow us to refrain from having to use a drawdown penalty as the floating equity would already be included. However, depending on the number of checkpoints, this calculation will slow down the backtest quite a bit.
You could also combine the k-ratio with other metrics into a custom proprietary score to get a more nuanced picture of each test run.
k_ratio.mqh (3.7 KB)
MT4 Version (requires OrderKFX Class): k_ratio_mt4.mqh (3.3 KB)
- Lars Kestner, Measuring System Performance, 1996
- http://www.styleadvisor.com/resources/statfacts/zephyr-k-ratio
- https://en.wikipedia.org/wiki/Standard_score
- Cochran, W.G. (1963) Sampling Techniques, Wiley, New York
Hi Klondike, this is a very interesting article and code. Is possible to get this mqh file for Metatrader 4? Thankyou very much.
Hi,
I just added an MT4-Version of the code. Let me know if it works. I didn’t test it thoroughly.
Thank you very much for the mt4 version, but I can not get it to work, I get several errors when compiling, thanks anyway.
I just did a test without compilation errors. Have you included the orderKFX.mqh from this article?
Hey Klondike, is better to optimize the k ratio with fixed lot sizes or is lot sizes based on equities okay to use?
Also just wondering if you guys have any other custom max formulas that are good. This ratio is very good but I’m just wondering.
Hi,
I would strongly advise using fixed lots whenever possible during a backtest/optimization. Especially when you are optimizing for the k-ratio as it tries to find the “smoothest” equity curve.
I wouldn’t rely on the k-ratio as the only metric. In my experience, you want to combine different metrics (profit/drawdown, expected payoff, etc.) in order to find the most promising sets.
Is it correct for the returned result to be 0.0 or -nand(ind) ?
This is all I get for result.
Might there be something wrong with my code, or does that mean that the results aren’t considered “smooth enough” ?
Great work!
Usually if the result is “0.0” the sample size of trades is too small to calculate the k-ratio.
Well, i’ve tried to add it in my EA but always returns 0 or “nan”. The sample size is huge… 2500 trades +
I am having the same problem with the result always being 0 or “nan”. I’m running mt4 and the sample size is 1000?
Any ideas…….?
Hi,
this most likely results from the “penalty” function in combination with a too-high penalty weight. For example, if the weight is “.5” the score will be zero for all Drawdowns bigger than ~15%. You will either need to adjust (lower) the DD Penalty Weight or ignore the DD Penalty by uncommenting its call or setting the penalty weight to 0.
Hi, would you be willing to lend some instructions on how to implement this code into an existing EA?
Thanks for receiving!
you will need to include the code at the top of your EA by adding
#include <k_ratio_mt4.mqh>At the end of each run, you will have a custom score that you can use to optimize for by choosing “Custom” as the optimized parameter inside the MT4 Strategy Tester.
Thanks, this is really useful.
One thing, a lot of the time i am getting too many results of99.99% and it kind of clouds the best or best proposed solutions within too many results. Looking at the code I am not 100% sure what to adjust to make getting 99.99% harder.
Could you assist please author?